Three Fun Activities for Teaching Statistics
A MiddleWeb Blog
I have heard so many teachers say they’re nervous about teaching statistics. I understand the feeling – I felt the same way when I started teaching AP Statistics about six years ago. At the time, I didn’t realize how great and useful and fun statistics could be. (I might be a little biased!)
Tried and True Activities to Make Statistics Fun
Knowing some teachers feel uneasy about teaching statistics, I thought it might be helpful to share activities I like to use. Although I teach AP Stats, many of the CCSS-related standards covered in AP Stats are also found in 6th, 7th and 8th grade in a more simplified form.
Measures of center (mean and median) and measures of variation (range, standard deviation, etc.) fall into that group. So do box plots, histograms, and dot plots. I think the activities I’m recommending here will transfer well to the middle grades.
Allow Students to Create their own Data
All of the standards mentioned above require students work with sets of data. The temptation when teaching these topics is to give students a set of numbers, which is quick and easy. That is exactly what I did for the first few years of teaching statistics.
I wasn’t sure what activities I could use that would tie into our standards and grab my students’ interest. It took about three years to build up a catalog of activities that required some trial and error.
Some activities I thought my students would love have not worked out (I’m looking at you, fruit roll-ups linear regression activity). But I learned early on that students are much more invested when they can create their own data, so I kept searching and trying out different ideas.
What I am sharing below are the activities that met the double test: they helped my students learn about statistics, and they had fun doing it.
A Word of Caution: After working through many data collection activities, I have learned that some activities can embarrass students or make them feel self-conscious. I now steer away from activities that divide students by gender, or anything to do with height or weight, for example.
SKUNK
(Useful for discussing basic properties of probability. Data collected from game can be used to create box plots, histograms and stem and leaf, and to calculate mean and standard deviation.)
I learned about this activity from our state science and math center when I was doing my student teaching. SKUNK is a game where students accumulate points when rolling a pair of dice. The teacher rolls two dice. (I use dice on my Smartboard – if you don’t have an interactive white board here is a website that simulates rolling dice.)
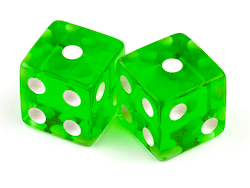
So a student will stand until they feel like a “bad roll” is coming (a one or double one). Once they sit down, they won’t lose any points but they won’t accrue any more points either.
This is a great game for discussing probability, but I l also like to use it to gather and describe data. We can use the points they earn during the game to gather classroom data to create boxplots, dot plots, stem plots, or histograms. I recommend doing this activity the first week of school – it’s a good kickoff and you’ll be able to use the data throughout the year. This year Skunk is one of the few activities I felt safe doing in person because students were standing at their own desks and could still stay socially distanced from each other.
(This PDF for grades 6-8 explains the game of Skunk and provides additional resources.)
Blind Stork Test
(Create box plots, stem plots and histograms. Useful for discussing outliers)

In my class, we used the data they collected to create box plots. On Sarah’s blog she explained that she had her students create a box plot, dot plot, stem and leaf, and histogram. If you decide to do this activity, you can visit Sarah’s blog where she has files that accompany the activity that you can download. As a bonus, this activity can also be done while social distancing. When we did it in my class this year, the students stood at their desk and timed themselves with their cellphones.
Dollar Store Puzzles
(Useful for calculating z scores or using the data to create box plots, histograms, or dot plots)
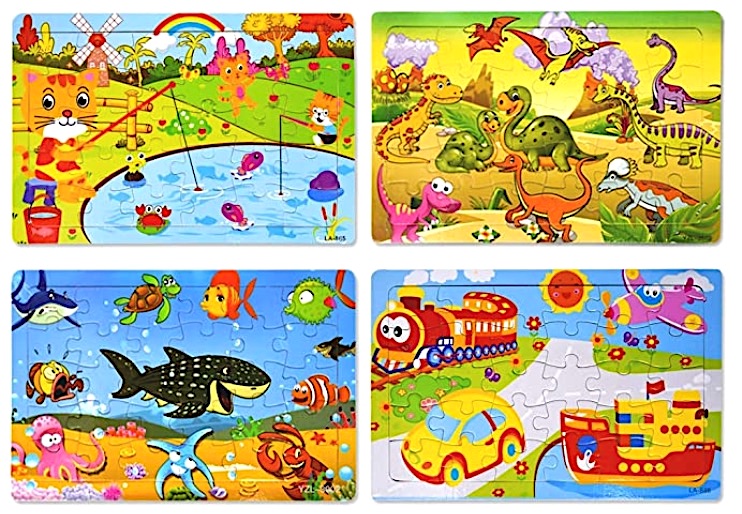
Another activity my students loved was timing themselves putting together simple puzzles. I went to the dollar store and bought 30 of the cheap $1 puzzles (they don’t have a lot of pieces), and then the students timed themselves putting the puzzles together.
My students were super engaged! I was actually surprised to see high school students enjoying putting together puzzles meant for much younger kids. We used the times they recorded to compute z-scores, but the data could be used to make box plots, histograms, or dot plots.
Statistics + Fun Activities = Engagement
I really love teaching Statistics and my students enjoy it too. But it’s taken a few years to find activities that really engage them and also reinforce the statistics standards they need to learn. I hope you can use one of these ideas in your classroom. And if you have great Stats activities that you are using, please share in the comments below.
ALSO SEE:
Michelle Russell’s 2023 post:
Some Stats Activities for Middle School Math
with two more fun activities for Gr. 6&8.







Michelle, I’m a science teacher, but reading your article makes me want to teach math. I wish I had had a math teacher like you along the way. I think it would have changed my relationship with math!
Thank you so much! I love teaching stats because you can do all these fun activities.
One activity I like to do is to simulate spread of a virus. I give each kid in the class a different number (say from 1 to 20) and designate the 1 as having the disease. That person then picks a random integer from calculator randint(1,20) to “infect” someone else. Then the next round the people who are infected pick random integer again. So they might pick themselves, someone who is already infected or someone new. At the end of each round, see how many are infected, and plot the points to see a logistic curve. If covid were’n’t still here, instead of doing on a calculator, could have kids blindfolded in a circle outside then have them wander each round until they touch someone then see how many are infected each round.
I love the dollar store puzzle idea! Alternatively, I think I will use a printable word-search and have students either see how long it takes them to solve, or how many words they can find in a set amount of time. I am going to have my different sections do this, and then we can conduct a t-test to see if the mean time (or number of words) is actually different between the two classes. Great idea to have the students create data sets this way! It’s much more engaging than height and shoe size, for sure. :) Thanks!
This is my first year teaching high school statistics. I have taught junior high for 28 years. I am very nervous and have no materials. I found your activities entertaining and want to use Skunk to start the year off. Thank you for sharing. If you have any other activities you are willing to share I would really appreciate it.
Thank you for sharing!
You are so welcome! My email is mrussell@florencek12.org. If you want to email me I would be glad to share other activities with you. Just let me know what you need and what would help!
HI I am a volunteer for STEM schools and looking for a fun data activity for year 10-12 students. If there is a link to a data source that would be awesome. What I want is to get some data and get the students engaged in some analytics activity, it can be imaginative or investigative, or given some sparse data to piece together a clue to solve a mystery.
Michelle, Thank you for sharing ideas on making statistics engaging to students! I am experimenting with embedding my basic statistics lessons in a computer game environment. The idea is to place the problems in an easy-to-understand context. The data game is work in progress.
If you know of other similar projects that I could share with my students, it would be very interesting to hear about it.